Health Check
Health Check measures with 48 checks whether the server is in the state it should be in; it does not change any setting.
What it measures
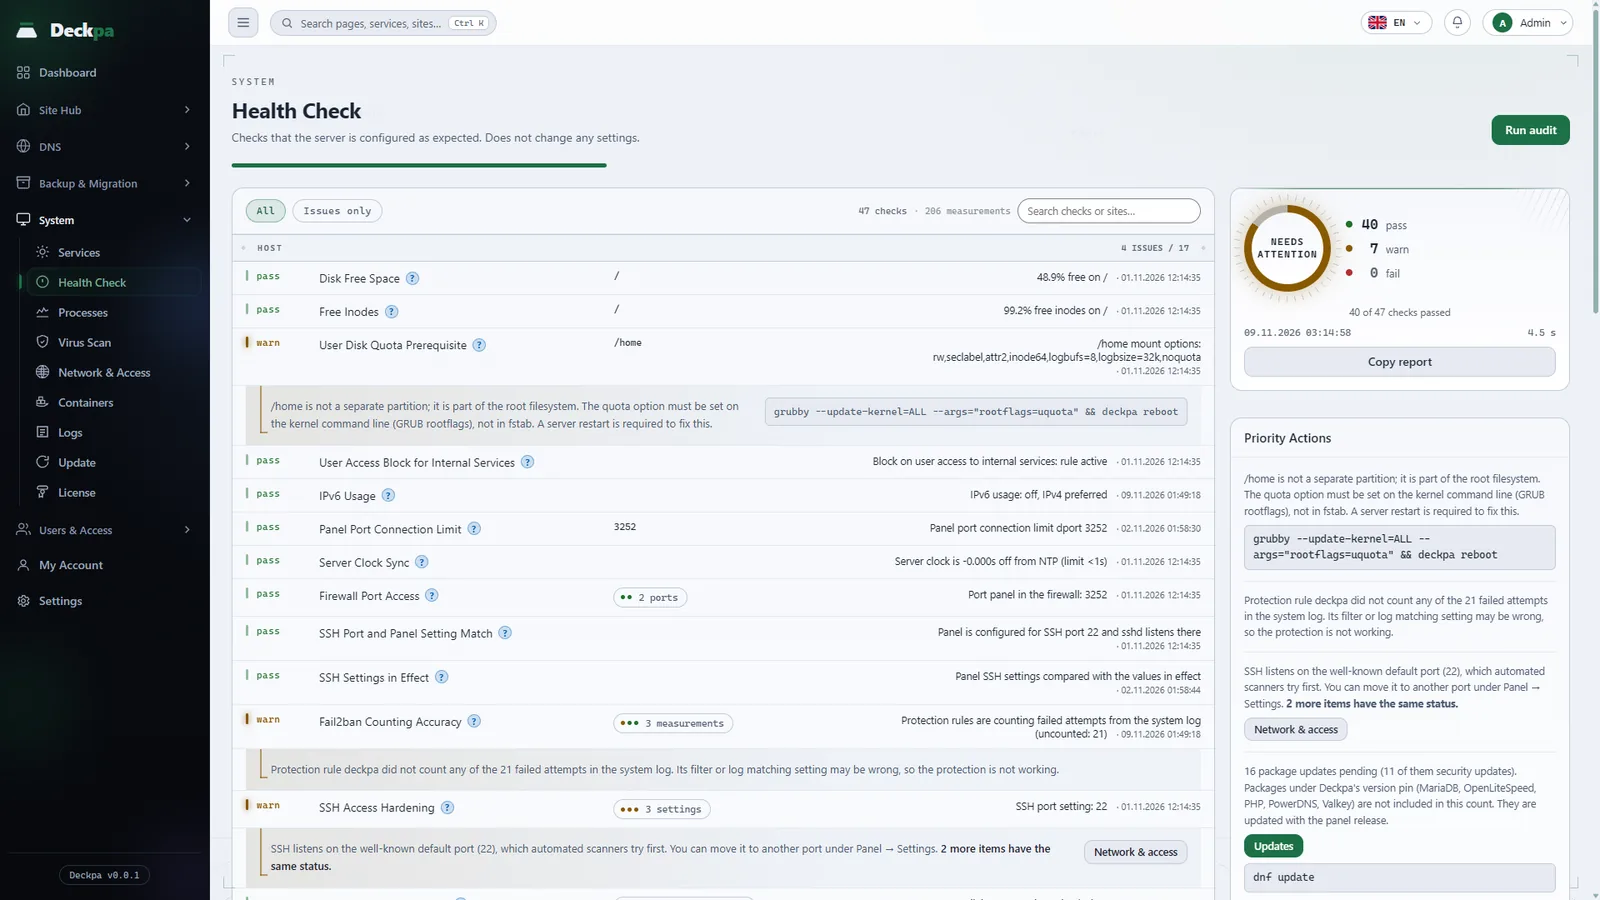
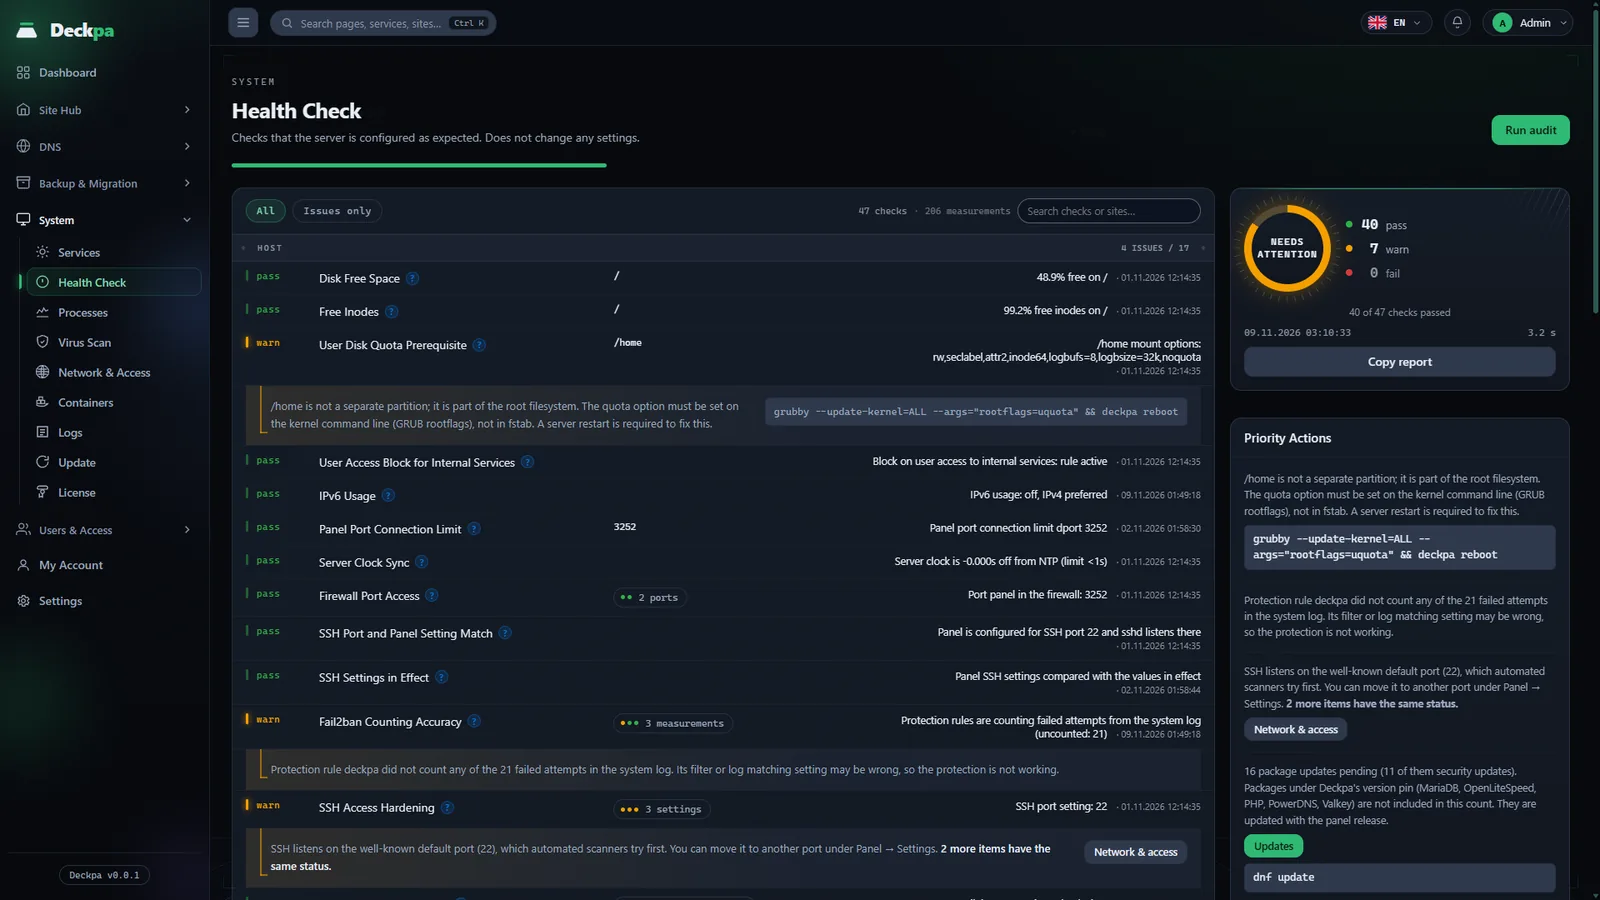
Health Check is a read-only audit that measures whether the server is in the state it should be in. It does not change any setting; it only measures, and shows the result and, where needed, what you should do. The screen is available to administrators only and is under System → Health Check.
The audit consists of 48 checks. The checks do not stop at "does the file exist"; they verify that the thing being measured actually works. For example, it is not enough for a Fail2ban protection rule to look active: the audit also measures whether the rule counts failed sign-in attempts when the system log contains them. The backup check does not look at whether a backup exists, but at how old it is.
One check can measure several things separately: each site, each PHP version or each disk partition gets its own result. In the table a row stands for a check; to see the results, press the button in the row, such as 3 sites. Two numbers appear at the top of the page: the number of checks and the total number of measurements.
Running the audit
The audit runs on its own when you open the page, and the result arrives within a few seconds. After you fix something, use the Run audit button at the top right to confirm it; this button measures every check again. When the page opens, it may take only the number of pending operating system updates from a measurement up to 10 minutes old. That is the slowest step of the audit, and the button skips this cache.
Each check has its own time limit. A check that does not return within its limit is marked not measured, and the other checks are not affected. The upper limit for the whole audit is 3 minutes.
Health Check measures only when you open the page or run the command; it does not monitor continuously in the background. For continuous monitoring, use Alerts.
Reading the result
The ring on the right shows a state, not a percentage: Healthy, Needs attention or Critical. The worst result decides the state. If a single check of critical importance fails, the ring turns Critical. No percentage is shown because a pass rate hides the worst result: one critical failure plus a few warnings can look better as a percentage. Next to the ring you see how many checks passed, warned and failed.
Each row starts with one of these state words:
- pass — the measured value matches what is expected.
- warn — the system works but is not in the ideal state. Example: SSH listens on its default port.
- fail — the expected state is broken. Example: SELinux is not in enforcing mode, or a site's document root has been deleted.
- not measured — the measurement could not be made (a required tool was not found, or time ran out). The reason is written in the row. Something that could not be measured is not counted as broken.
- prerequisite — this check was not measured because a check that has to pass first has failed. The row names the check that has to pass first. For example, if the MariaDB service is not running, database authentication is not measured.
The ? mark next to a check name shows what the check measures and what it passes on. For a check that measures several subjects, the subject list shows the measured value of each site, version or partition separately. The Issues only button at the top hides rows that passed, and the search box searches both check names and site names.
If a check came out differently from the previous audit, the row shows a changed badge and a "N changes since the last audit" strip appears at the top of the page. View list shows the checks that changed and their earlier states. Only audits run from the panel are recorded in this history; audits run from the command line are not.
The Priority Actions box on the right lists failures first, then warnings. When a fix needs a command, the command is written so you can copy it; when there is a related screen (Services, Network & Access or backup schedules, for example), there is a button that goes there. The panel does not run these commands for you. The Copy report and Copy server info buttons put the report and the server information on the clipboard so you can attach them to a support request.
Audit tiers
The 48 checks are split into five tiers. The tiers are measured in the order below; you can click a tier in the Audit Tiers box on the right to jump to its section in the table.
- Host (17 checks) — main checks: Disk Free Space, Free Inodes, Server Clock Sync, Firewall Port Access, Fail2ban Protection Rules, SSH Access Hardening, SSH Key Login Readiness, Kernel Restart Required, Pending System Updates, IPv6 Usage.
- Privilege Boundary (8 checks) — main checks: SELinux Enforcing Mode, SELinux Executable Labels, Process List Hiding (hidepid), System Service Socket Permissions, Secret File Permissions, Site Home Directory Permissions, Root Temp Directory Permissions, Backup and Log Directory Permissions.
- User Isolation (10 checks) — main checks: Per-Site Temp Directory Isolation, Site File Access Scope (open_basedir), PHP function restrictions (per site and per version), FTP Directory Restriction (chroot), Docroot Present, Site–PHP Version Match, Cron–PHP Version Match, Per-Site Custom OLS Configuration.
- Services (7 checks) — main checks: Service Status, MariaDB Root Authentication, Version Pin Compliance, OPcache Status, DNS Zone Coverage, ClamAV Engine Version, Unofficial Signature Set Coverage.
- Panel State (6 checks) — main checks: SSL Certificate Expiry, Panel Database Integrity, Backup Freshness, Cron Job Last Run, Orphaned Site Directories, File Change Watcher.
Every check has an importance: critical or warning. Disk Free Space is a critical check, but the result is a warning when free space drops below 10 percent and a failure when it drops below 5 percent. The importance of a check decides the state of the ring and the exit code on the command line.
The Server Info box on the right shows which server the audit ran on: host name, operating system, panel version, PHP versions, open ports, services, hardware and uptime.
Running from the command line
You can run the same audit on the server as root with the deckpa doctor command. The command always measures fresh. Its output is in English and ends with a "next steps" list that collects the fix commands.
deckpa doctor
deckpa doctor --quiet
deckpa doctor --tier host
deckpa doctor --only disk-free,time-sync
deckpa doctor --json
--quiethides rows that passed. The summary and the next steps are still printed.--tiermeasures a single tier. Valid names:host,privilege,tenant,service,panel.--onlymeasures the check IDs you list, separated by commas. The prerequisites of a check are added automatically; otherwise the result would be misleading when a prerequisite is broken.--jsonprints the report in a machine-readable format.
The exit code can be used in scripts: 0 means everything is clean, 1 means a critical check failed, and 3 means there is at least one warning or a non-critical failure. not measured and prerequisite results do not affect the exit code.
Common situations
- "Kernel Restart Required" — a new kernel is installed but the server is still running the old one. Security patches take effect only after a restart; restart the server at a suitable time.
- "Server Clock Sync" — clock drift can break two-step verification codes, TLS validation and DNS in ways that look unrelated. Confirm that the clock synchronization service is running.
- "Pending System Updates" — the number of pending packages and the number of security updates are written separately. Packages whose version Deckpa pins (MariaDB, OpenLiteSpeed, PHP, PowerDNS, Valkey) are not included in this number; they are updated together with the panel version.
- "Fail2ban Counting Accuracy" — if the system log contains failed attempts but no protection rule counts them, the protection is not working. A block count of 0 is not a problem by itself; attempts below the threshold also produce 0 blocks.
- "Backup Freshness" — warns when a site's newest backup is older than expected or when there is no backup at all. For the fix, see the schedule steps on the backup page.
- "SSL Certificate Expiry" — a site without a certificate is not counted as a problem; SSL is optional. For a certificate that is about to expire, see SSL certificates.