Logs
Logs gathers the records of the panel and the server on one screen; retention periods and the disk cap are set here.
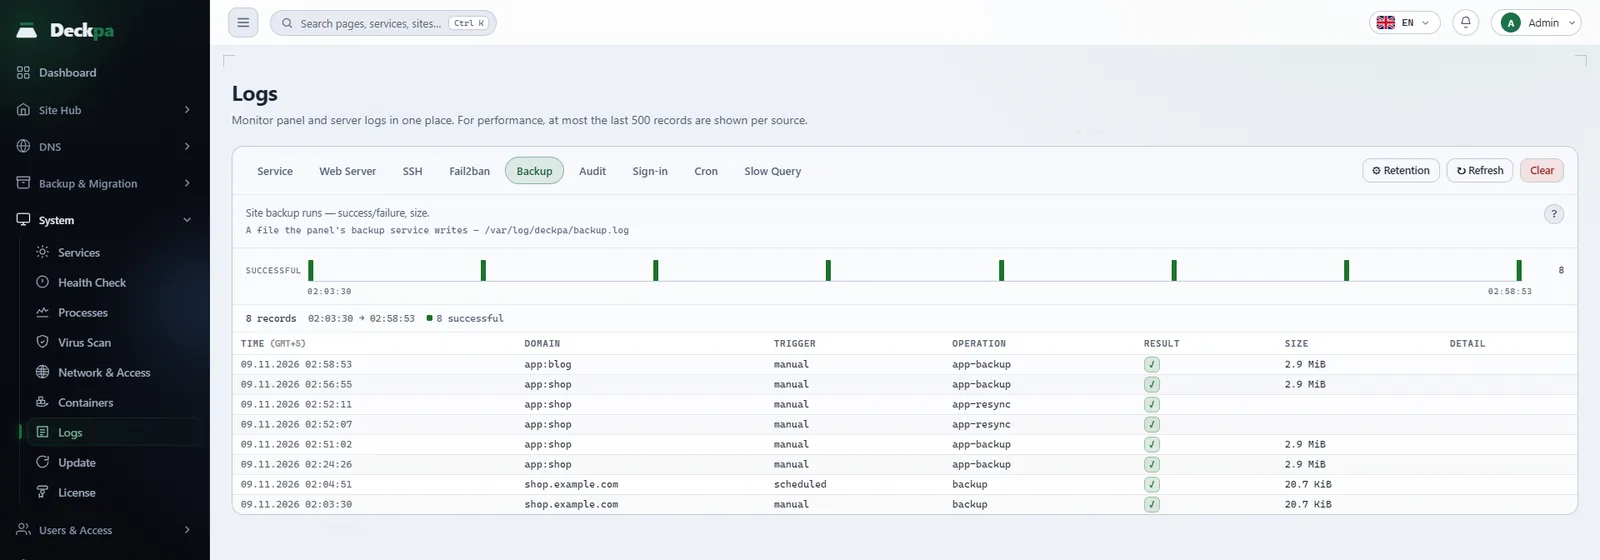
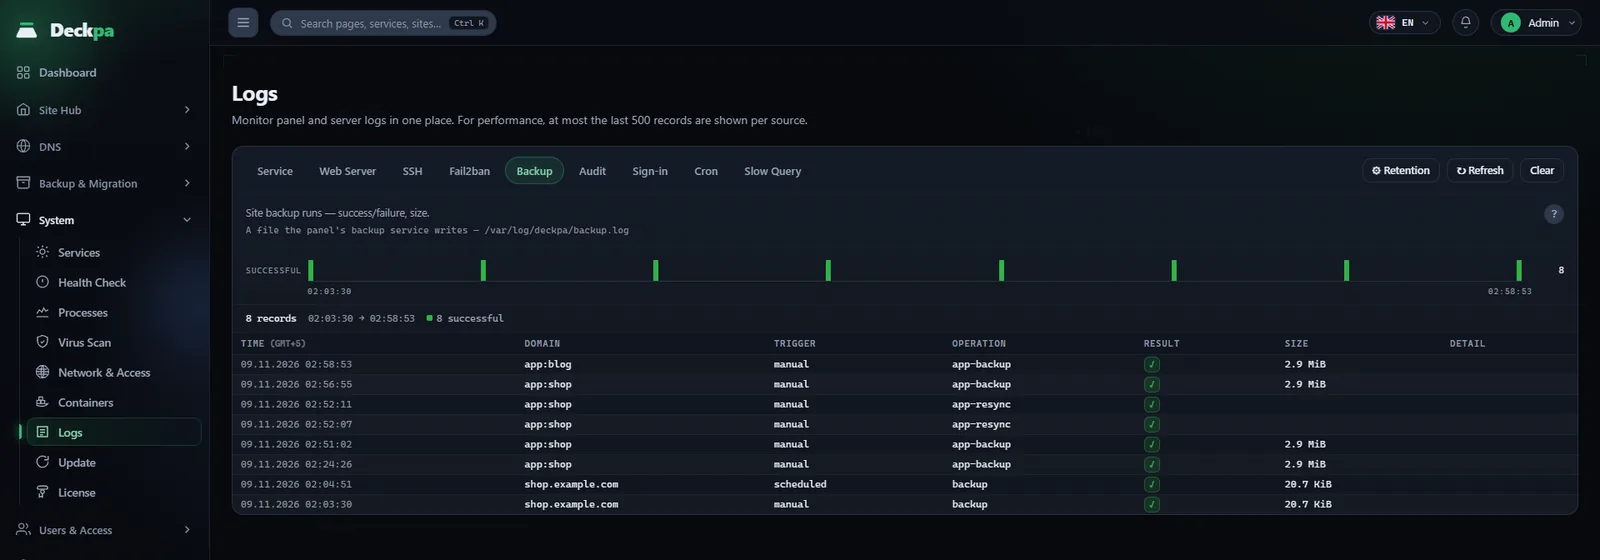
The Logs page
Logs gathers the records of the panel and the server on one screen. The page is under System → Logs and is available to administrators only. For performance, at most the last 500 records are shown for each source; to reach older records you need to look at the file on the server.
The sources are tabs. The order follows the questions an administrator asks when troubleshooting: first whether the system is up, then security, then whether the data is safe, then what changed, and last fine-tuning. When you select a tab, a one-line description of the source and where the records come from appear at the top; the ? icon explains what the log is for.
The top bar has these buttons: Refresh reads the log again, Clear empties the file of the selected source (it asks for confirmation and cannot be undone), and Retention opens the retention settings. The page does not refresh by itself; press Refresh to see new records.
Tabs
- Service — the output of the service you select (web server, database, FTP and so on), read from the system log. If a service does not start or stopped unexpectedly, the reason is usually written here. You change the service with the selector at the top of the tab.
- Web Server — OpenLiteSpeed's server-wide error files (
/usr/local/lsws/logs/error.logandstderr.log). Configuration errors, an invalid certificate path, rewrite rules that do not work and fatal PHP errors are written here. If a site returns a blank page, you will often find the reason in this tab. The filter shows Errors and warnings only by default; choose All to see routine records as well. - SSH — attempts to sign in to the server over SSH. Every server open to the internet gets automated scans all the time, so a large number of failed attempts is normal. What matters is that the successful sign-ins are yours.
- Fail2ban — the record of the service that automatically blocks addresses with repeated failed sign-ins. Seeing records here shows the protection rule is working. Each blocked address has a Remove block button; if you blocked your own address by mistake, you can remove the block from here. The summary at the top of the tab writes the number of attempts each protection rule counted next to the number of attempts in the system log; if the counted number stays at zero while the log contains attempts, the panel says the protection rule is not working.
- Backup — when backups were taken, how long they took, their size and whether they failed (
/var/log/deckpa/backup.log). A backup that fails silently is the same as a backup that was never taken; verify here from time to time. - Audit — the record of every administrative action taken in the panel: who did what and what the result was. Creating and deleting sites, user and permission changes, stopping services and restoring backups all appear here. If something changed unexpectedly, look here first. The file (
/var/lib/deckpa/audit.log) is append-only and cannot be cleared from the panel. - Sign-in — who tried to sign in to the panel, from which address, when, and the result. If you see a successful sign-in from an address you do not recognize, change your password and turn on two-step verification.
- Cron — when scheduled tasks ran. If you think a task is not running, first check here whether it was triggered; most of the time the task runs but fails inside.
- Slow Query — queries in MariaDB that exceed the time threshold (
/var/log/deckpa/mariadb-slow.log). If the slow query log is off, the tab shows a note saying so.
The result and level columns in the table are shown with colored labels. If the records contain problems, a summary appears above the table: the number of problem records, when the latest one happened and the user or address that appears most. If records were created in quick succession within seconds, the panel mentions it in a note and asks you to verify the source in the table; it does not interpret the situation itself.
Site logs
A site's own access and error records are not on this page but inside the site: Site Hub → [site] → Logs. It has two tabs: Access (incoming requests) and Error (web server and PHP errors and warnings). A site owner can read only the logs of their own site. The files are kept outside the site's home directory (/home/.deckpa-data/example.com/logs/), so they do not show up over FTP and cannot be changed by a script uploaded to the site.
Retention and disk usage
The administrator uses the Retention button to set how long logs are kept. At the top of the card that opens, the current disk usage is written as total, sites, panel, system and disk. Records are archived and deleted automatically under the selected policy; no manual maintenance is needed. There are two ready-made profiles:
- Standard — 30 days — enough for everyday use. Site logs are kept for 30 days, the audit record for 180 days, the sign-in record for 90 days and the system log for 30 days. The cap is 512 MB for the system log and 100 MB for a single log file.
- Long — 1 year — meant for servers whose operator has record-keeping obligations; it uses more disk space. All periods are 365 days; the system log cap is 2048 MB and the file cap is 200 MB. You decide which period meets your obligations.
In the Custom profile you set six fields yourself: the number of days for site logs, audit, sign-in records and system (between 1 and 3650), the system log cap (between 64 and 20000 MB) and the file cap (between 10 and 2000 MB). Values outside these ranges are brought to the limit. The slow query log is kept for 7 days in every profile, and the backup log is kept as long as the audit record.
The file cap matters as much as the period: a sudden spike in bot traffic can fill the disk overnight. When the cap is exceeded, the log is archived even if its period has not expired. Rotation is checked every hour, so the cap works without waiting for the end of the day. The Apply button puts the setting into effect immediately, trims the existing excess and moves the system log to persistent storage, so SSH, cron and fail2ban records are not lost after a restart.
Common situations
- A site returns a blank page — look at the Web Server tab first, then the site's Error tab. PHP errors also appear in the second one.
- You cannot sign in to the panel — repeated failed attempts lead to a sign-in lock and a Fail2ban block. Connect to the server over SSH and, as root, remove the sign-in lock with
deckpa unlockand the Fail2ban block withdeckpa unban. You can see the cause in the panel on the Sign-in and Fail2ban tabs. - A backup looks like it was taken but you are not sure — look at the result column in the site's row on the Backup tab. The backup freshness check in Health Check also measures the age; see Health Check for details.
- The disk is filling with logs — look at the disk usage in the Retention card and lower the file cap. If you have a constant bot load, you can stop that traffic before it reaches the server with Cloudflare access rules.